The difference in one sentence
Here's the simplest way to think about it:
The core distinction
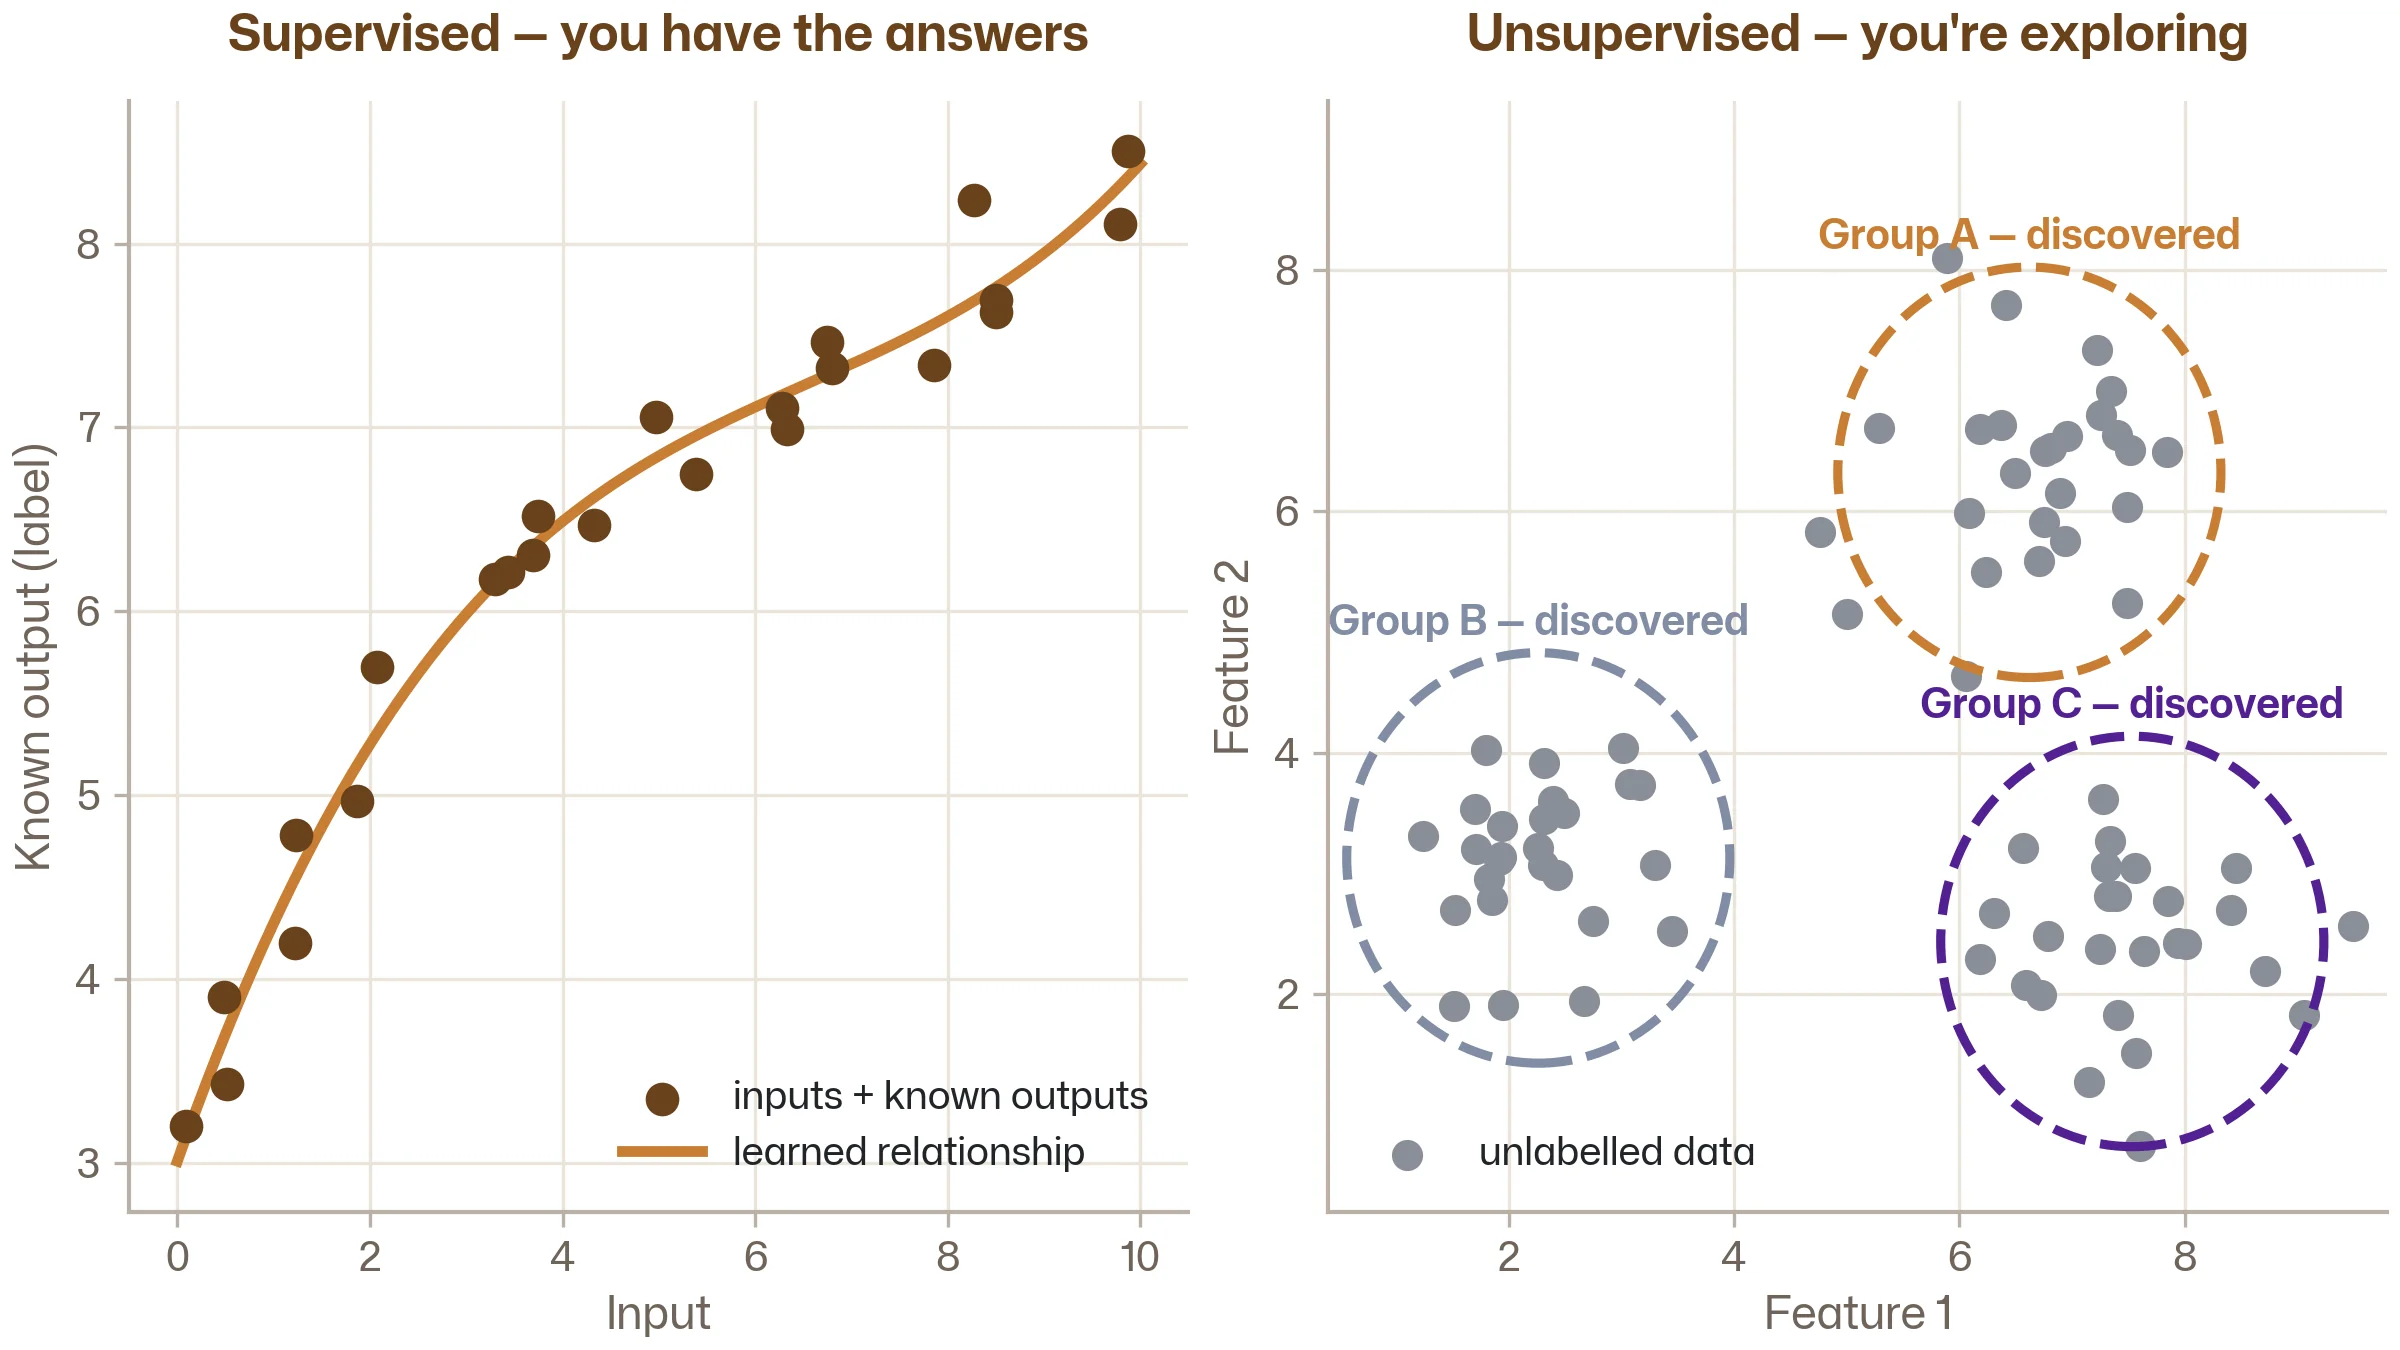
Supervised learning: you have the answers. You're teaching the model to reproduce them.
Unsupervised learning: you don't have the answers. You're asking the model to find structure you haven't seen yet.
That's the core distinction. Everything else — the algorithm names, the techniques, the maths — follows from this one difference. Do you know the output you're trying to predict, or don't you?
If you've ever fitted a curve to experimental data, you've done supervised learning. You had the measurements (inputs) and the results (outputs), and you found a relationship between them.
If you've ever looked at a scatter plot of test results and noticed that the data points seem to fall into distinct groups — without anyone telling you those groups exist — you've done unsupervised learning. You discovered structure in the data on your own.
ML just automates and scales both of these, to more variables and more data than a human could handle.
Supervised learning: teaching by example
In supervised learning, you provide the model with examples where you already know the correct answer. The model's job is to learn the relationship between inputs and outputs well enough to predict the output for new, unseen inputs.
Think of it as training a new colleague. You don't explain the underlying physics from first principles. Instead, you show them dozens of past cases: "these were the process settings, and this was the result." After enough examples, they develop an intuition for predicting the outcome of new situations — even ones they haven't seen before.
The word "supervised" comes from the idea that the labels act as a supervisor, telling the model whether its predictions are right or wrong during training. The model makes a guess, checks it against the known answer, measures the error, and adjusts. Over and over, until the error is small enough.
You already encountered this loop in the What Is Machine Learning? article — data in, pattern found, predictions out. Supervised learning is simply the version where you have labelled data to learn from.
The two flavours of supervised learning
Supervised learning comes in two types, depending on what you're predicting:
Regression — predicting a continuous number. What will the surface roughness be? What's the expected stress at this load? How much energy will this building consume next month? The output is a value on a continuous scale.
Classification — predicting a category. Will this part pass or fail inspection? Is this vibration pattern normal, degraded, or critical? Does this weld fall into quality grade A, B, or C? The output is a class label.
We'll cover both in detail in the next article, Regression vs Classification. For now, just know that they're both supervised learning — the difference is only in the type of output.
Engineering examples of supervised learning
Every one of these is a real application of supervised ML in engineering:
Predicting surface roughness from CNC parameters. Features: feed rate, spindle speed, depth of cut, tool wear. Label: measured surface roughness (Ra). This is regression — the output is a number.
Classifying welds as pass or fail. Features: welding current, voltage, travel speed, wire feed rate, shielding gas flow. Label: inspection result (pass/fail). This is classification — the output is a category.
Estimating remaining useful life of a bearing. Features: vibration RMS, peak frequency, temperature, operating hours. Label: time until failure (from historical records). This is regression.
Predicting maximum stress from FEA design variables. Features: wall thickness, fillet radius, material properties, load magnitude. Label: maximum von Mises stress (from simulation). This is regression — and it's the basis of surrogate modelling, which we'll cover in Stage 4.
Notice the pattern: in every case, you have historical data where both the inputs and the output are known. That's the defining characteristic of supervised learning.

Unsupervised learning: discovering what you didn't know to look for
Unsupervised learning is fundamentally different. There are no labels. No "correct answers." You give the model a table of features and ask: is there any structure in here that I'm not seeing?
This might sound vague, but it's incredibly practical in engineering. You often have mountains of data — sensor logs, process records, material test results — with no clear output variable to predict. You're not trying to predict anything specific. You're trying to understand your data better.
The model looks at all the data points, measures how they relate to each other, and groups or organises them based on similarity. The result isn't a prediction — it's an insight. "Did you know your machine operates in four distinct modes?" or "These 12 batches of material are fundamentally different from the rest."
Think of it as the difference between asking a specific question and saying "show me what's interesting." Supervised learning answers a question you've already defined. Unsupervised learning helps you find questions you didn't know to ask.
The main types of unsupervised learning
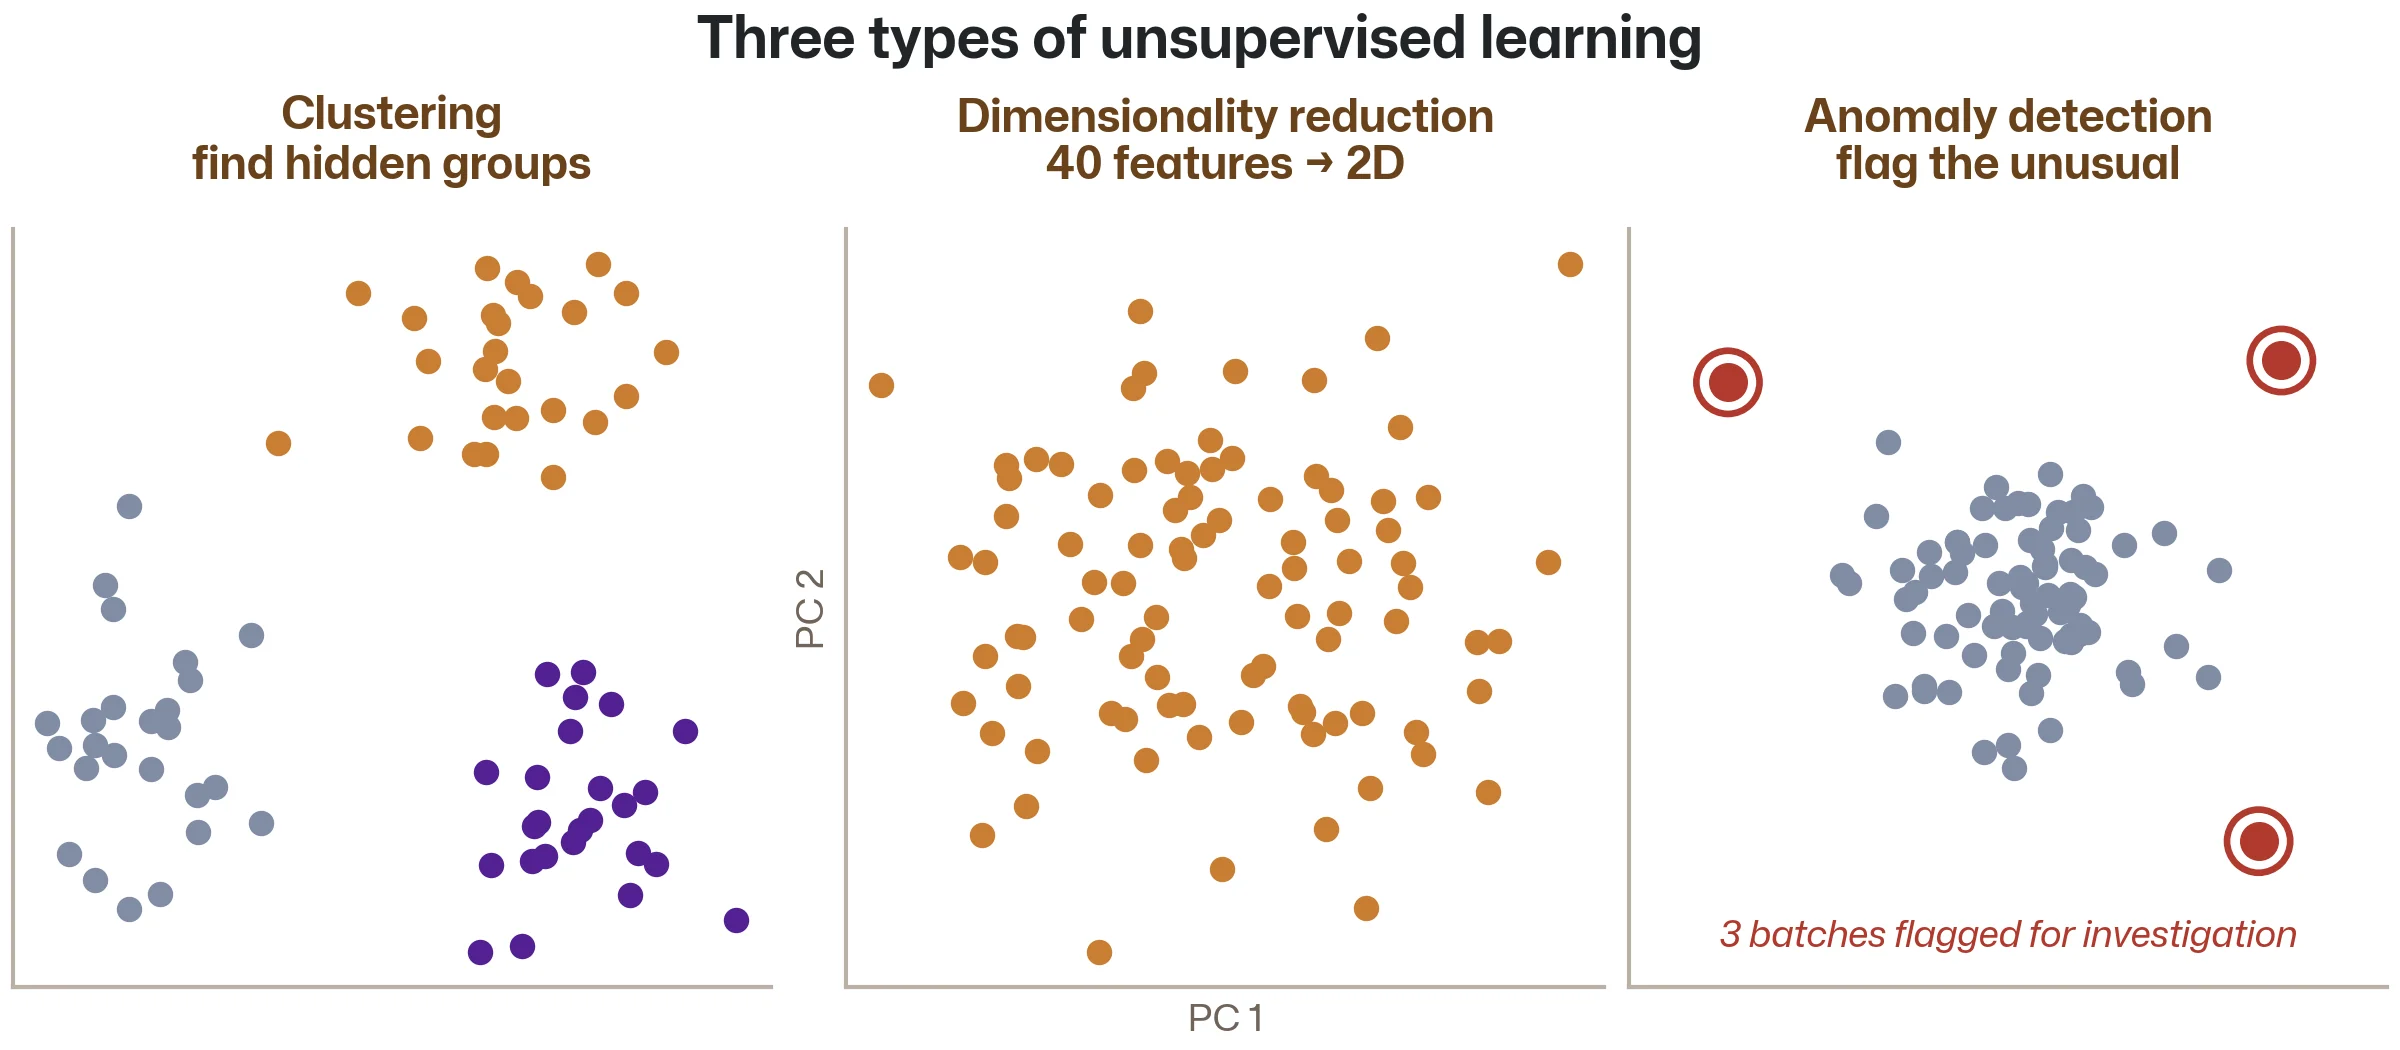
Clustering — grouping similar data points together. The algorithm finds natural groupings in your data that you didn't define in advance. K-Means and DBSCAN are common algorithms for this.
Dimensionality reduction — simplifying complex data while preserving its essential structure. If you have 50 correlated measurements, dimensionality reduction (like PCA — Principal Component Analysis) can reduce them to 3 or 4 underlying factors that capture most of the variation. It's like finding the axes that matter most.
Anomaly detection — identifying data points that don't fit any normal pattern. This is clustering's cousin: instead of asking "what groups exist?", you're asking "which points don't belong to any group?"
Engineering examples of unsupervised learning
Discovering machine operating modes. You have a year of sensor data from a CNC machine — spindle load, feed rate, vibration, temperature — but nobody has documented how the machine is actually being used. Clustering reveals four distinct operating regimes that correspond to different part types and tooling configurations. Operations didn't know these clusters existed.
Reducing material test complexity. You routinely measure 40 properties for each alloy batch, but many of these measurements are highly correlated. PCA reveals that three principal components capture 90% of the variation. You can now visualise your entire material database in 2D and immediately spot which batches are outliers.
Flagging anomalous production batches. Your chemical process has been running for months, generating multivariate sensor data. An anomaly detection algorithm flags three batches that look subtly different from all others — different enough that they warrant investigation, but not different enough that an operator would have noticed from individual sensor charts.
Segmenting warranty claims. You have thousands of warranty records with component type, failure mode, operating conditions, and time-to-failure. Clustering reveals that what you thought was one failure mode is actually two distinct patterns with different root causes — one driven by temperature cycling, the other by humidity exposure.
How to tell which one you need
The deciding factor is simple: do you have labels?
Look at your data. Is there a column that represents the "right answer" — the thing you want to predict? If yes, supervised learning. If no, unsupervised learning.
In practice, the decision is often more nuanced than that, so here's a more complete guide:
Use supervised learning when:
- You have historical data with known outcomes (measured results, inspection records, simulation outputs)
- You have a specific question: "what will the stress be?" or "will this part pass?"
- You want to predict an output for new, unseen inputs
- You need a model you can evaluate with clear metrics (was the prediction right or wrong?)
Use unsupervised learning when:
- You have lots of data but no labels — just features, no outcomes
- You're exploring: "what patterns exist in this data?"
- You want to reduce complexity before applying supervised methods
- You're looking for anomalies or outliers that don't fit normal patterns
- You want to segment or group your data in a way that hasn't been defined yet
Use both, in sequence: This is more common than people think. A very practical engineering workflow is to use unsupervised learning first (cluster your data, reduce dimensions, spot anomalies), and then use supervised learning on the cleaned, structured result. For example: use clustering to discover that your production data contains three distinct operating regimes, then build a separate supervised model for each regime. The combination often outperforms either approach alone.

What about reinforcement learning?
You might have heard of a third type: reinforcement learning. This is the approach behind game-playing AI (AlphaGo, chess engines) and robotics. Instead of learning from historical data, an agent learns by interacting with an environment — taking actions, receiving rewards or penalties, and gradually figuring out the best strategy.
Reinforcement learning is fascinating but rarely relevant for most engineering data problems. It shines in situations where an agent must make a sequence of decisions in an environment that responds to those decisions — robot arm control, autonomous navigation, process control optimisation over time.
For the kind of work this knowledge base focuses on — analysing tabular engineering data, building predictive models, replacing simulations — supervised and unsupervised learning cover the vast majority of use cases. If you encounter reinforcement learning in the wild, you'll now know where it fits: it's a third paradigm, separate from both supervised and unsupervised, and it solves a fundamentally different type of problem.
A quick mental exercise
Think about two datasets you have access to at work:
Identify your learning type
Dataset 1 — supervised candidate: What data do you have where you know both the inputs AND the outcome? Test results with measured properties? Simulation outputs with known design parameters? Production records with quality results?
Dataset 2 — unsupervised candidate: What data do you have where there's no clear "answer" column, but you suspect there are hidden patterns? Sensor logs nobody has systematically analysed? Process data with too many variables to visualise? Test results that might fall into natural groups?
If you can identify one of each, you're already thinking like someone who can apply ML. The algorithms are just the tools — the skill is recognising which type of problem you're looking at.
Key takeaways
Supervised learning = you have the answers. You provide labelled examples (inputs + known outputs), and the model learns to predict the output for new inputs. This covers regression (predicting numbers) and classification (predicting categories).
Unsupervised learning = you're exploring. You provide data without labels, and the model finds structure — clusters, patterns, anomalies, simplified representations — that you didn't define in advance.
The deciding factor is whether you have labels. If your data has a column with the "right answer," start with supervised learning. If not, unsupervised learning helps you understand what you've got.
Both types solve real engineering problems. Supervised learning predicts stress, classifies defects, estimates remaining life. Unsupervised learning discovers operating modes, reduces measurement complexity, flags anomalies. Neither is more advanced than the other — they answer different questions.
You've done both before. Curve fitting is supervised learning. Eyeballing clusters in a scatter plot is unsupervised learning. ML just scales these intuitions to dozens of variables and thousands of data points.
Follow the learning path
This is article 4 in a structured series. Subscribe and we'll send you a short email when the next one drops — plus monthly ML insights for engineers. No spam, no fluff.
Subscribe to the newsletter