It all comes down to the type of output
In the previous article, we established that supervised learning is about predicting an output from inputs, using historical examples where you already know the answer. Now here's the follow-up question: what kind of answer are you predicting?
There are only two possibilities:
The only difference
Regression: the answer is a number. A continuous value on a scale.
Classification: the answer is a category. A label from a fixed set of options.
That's the entire distinction. The inputs (features) can be identical. The algorithms are often similar. The only difference is the nature of the output.
Regression examples:
- What will the surface roughness be? → a number in µm
- What's the maximum stress in this design? → a number in MPa
- How many hours until this bearing fails? → a number in hours
- What will the energy consumption be next month? → a number in kWh
Classification examples:
- Will this part pass or fail inspection? → one of two categories
- What type of defect is this? → one of several categories (crack, porosity, inclusion)
- Is this vibration pattern normal or anomalous? → one of two categories
- Which material grade does this sample belong to? → one of several categories
If the answer lives on a continuous scale, it's regression. If the answer is one of a defined set of buckets, it's classification. That's it.
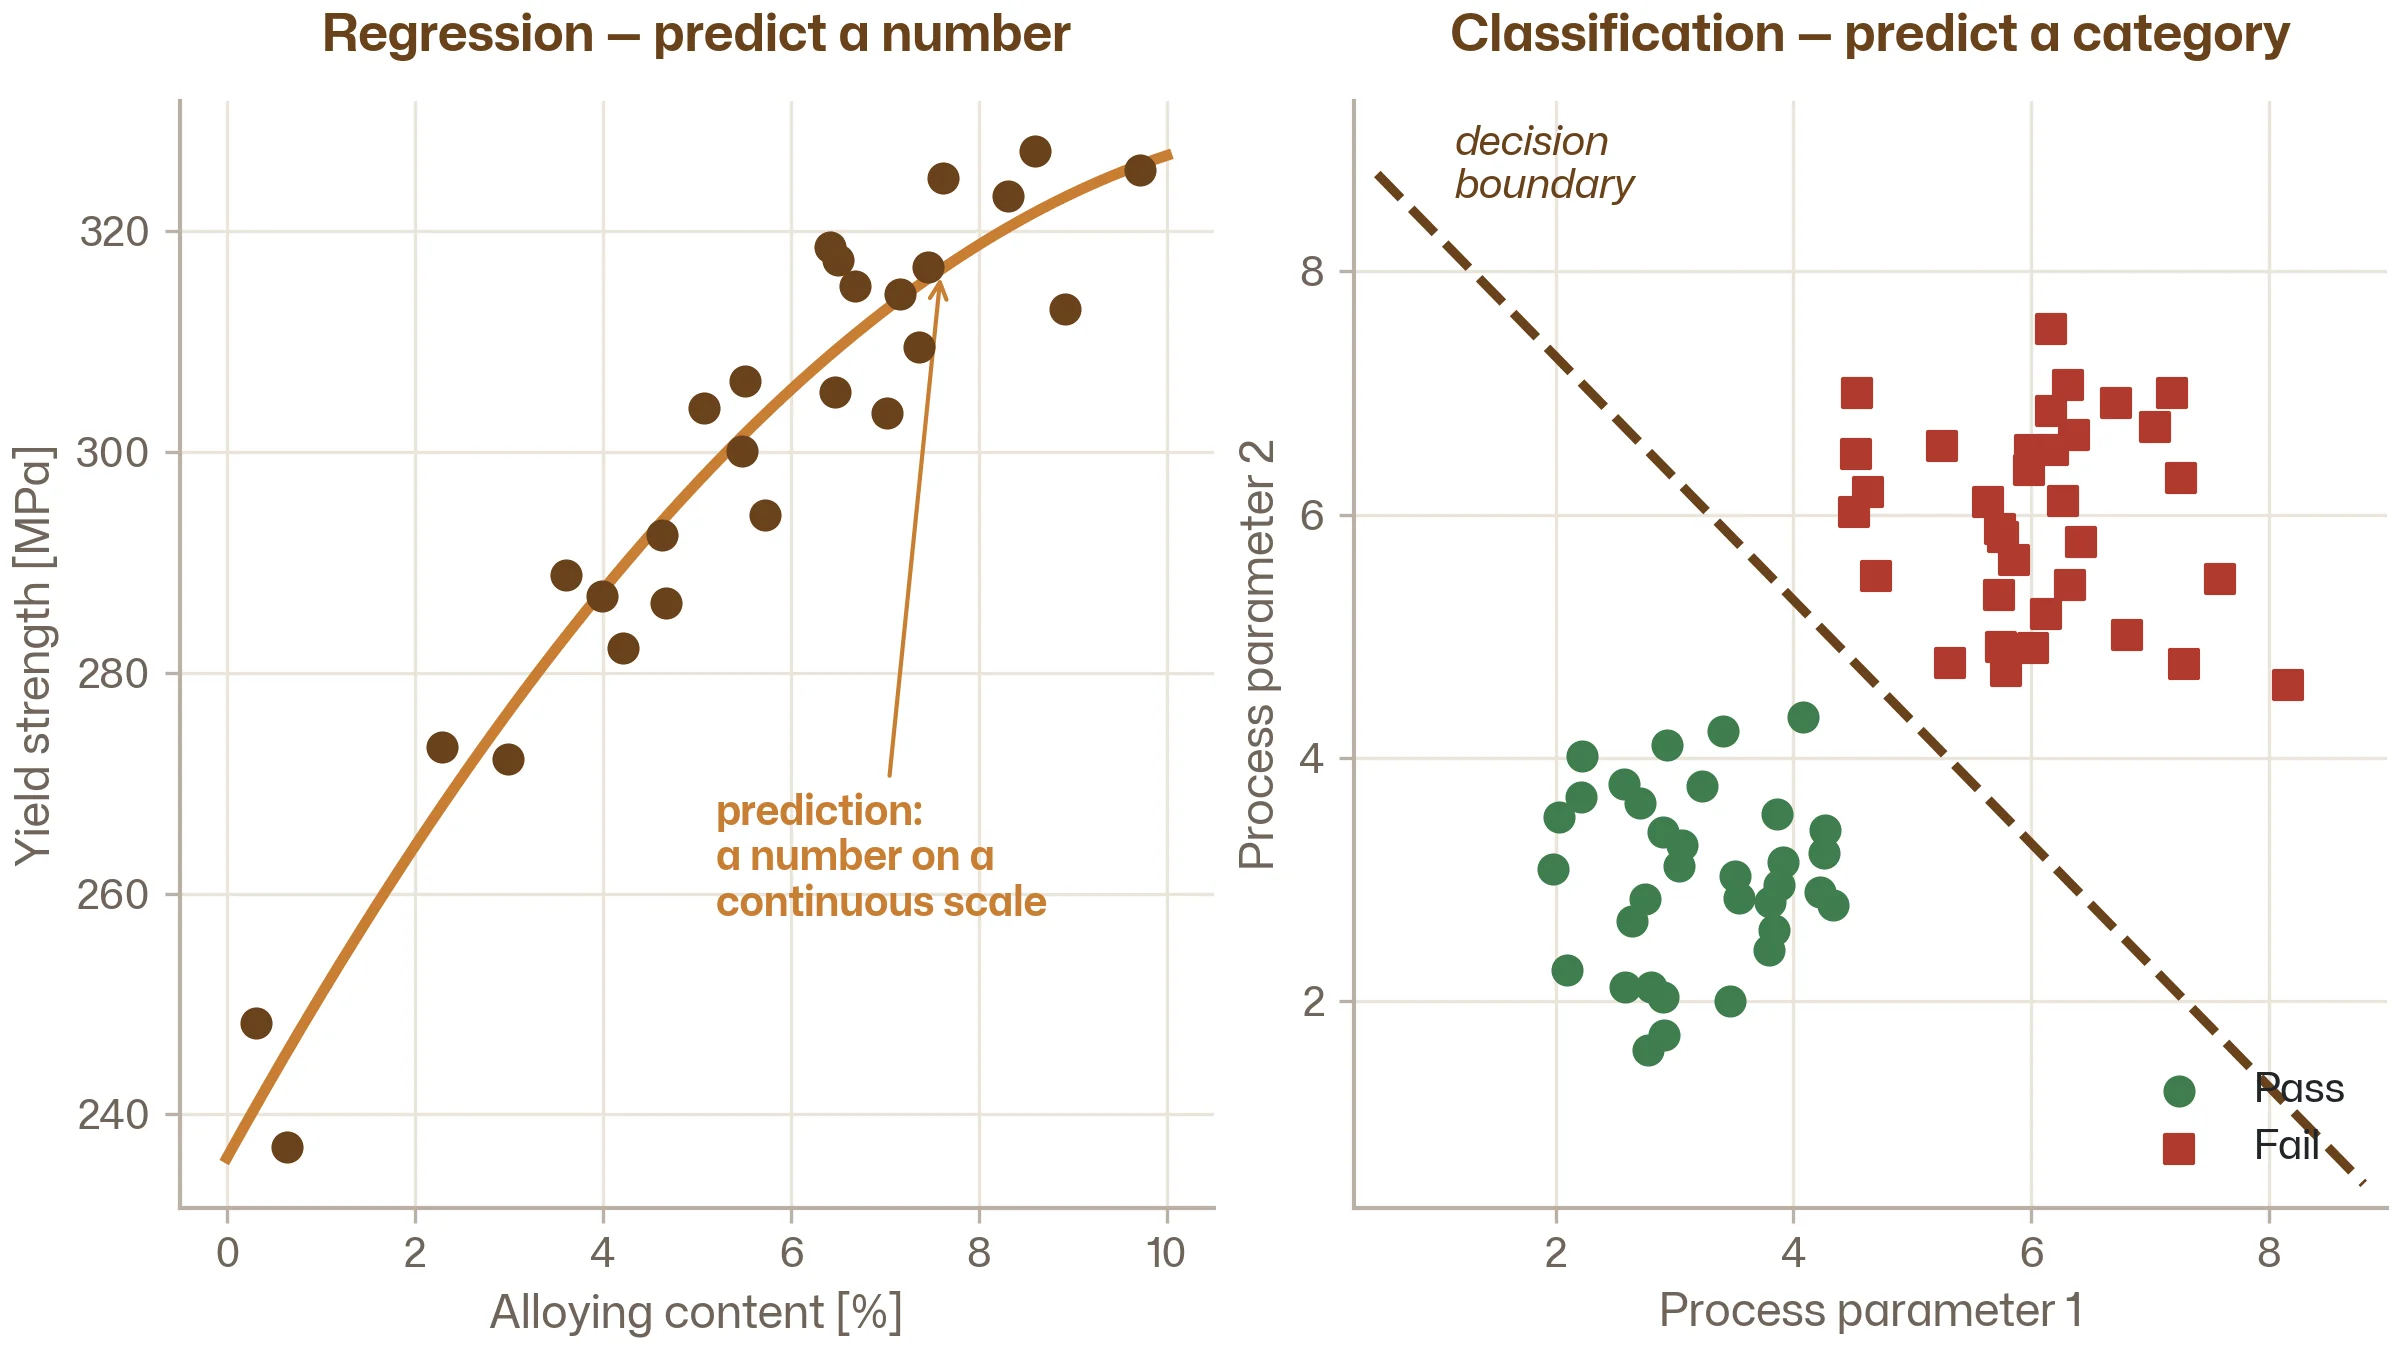
Regression: predicting a number
Regression is the type of ML that feels most natural to engineers, because you've been doing it informally your entire career. Every time you've fitted a trendline in Excel, interpolated between data points, or built an empirical correlation from test results — that was regression.
The only difference with ML regression is scale and flexibility. Instead of fitting a line to two variables, you can fit a complex, non-linear relationship across dozens of variables simultaneously. And you don't have to guess the shape of the relationship — the algorithm figures that out from the data.
What "regression" actually means
The model learns a function that maps inputs to a continuous output. Given a new set of inputs, it returns a number — its best estimate of the output.
For example: you have 500 rows of CNC machining data. Each row contains the process settings (feed rate, spindle speed, depth of cut, tool wear) and the measured surface roughness. A regression model learns the relationship between settings and roughness. Then, for a new combination of settings it hasn't seen before, it predicts what the roughness will be.
The prediction won't be exact — there's always some error. The goal is to make that error small and consistent enough to be useful. "Useful" depends on your engineering context: predicting stress within ±5 MPa might be perfectly fine for early-stage design exploration, but useless for a safety-critical certification.
Engineering use cases for regression
Predicting simulation outputs from design parameters. This is surrogate modelling — the idea that you can train an ML model on a few hundred simulation results and use it to predict outcomes for thousands of new designs, in milliseconds instead of hours. We'll cover this in detail in Stage 4.
Estimating material properties from composition and processing. Instead of running an expensive tensile test on every batch, predict yield strength from alloy composition, rolling temperature, and cooling rate. Not a replacement for testing — but a fast screening tool that flags batches likely to be out of spec.
Forecasting energy consumption. Given weather data, occupancy, time of day, and building parameters, predict how much energy an HVAC system will consume. Useful for scheduling, demand response, and identifying inefficient operating patterns.
Predicting remaining useful life. Given current sensor readings (vibration, temperature, pressure) and operating history, estimate how many hours of useful life a component has left. The output is a number — hours, cycles, or kilometres.
Classification: predicting a category
Classification is what you need when the output isn't a number on a scale but a label from a set of options. The model looks at the inputs and decides which category the data point belongs to.
Binary vs multi-class
Classification comes in two varieties:
Binary classification — two possible outcomes. Pass or fail. Good or defective. Normal or anomalous. This is by far the most common type in engineering quality applications.
Multi-class classification — three or more possible outcomes. Defect type A, B, or C. Material grade 1, 2, 3, or 4. Machine operating mode: startup, steady-state, cooldown, or fault. Each data point gets assigned to exactly one category.
What the model actually does
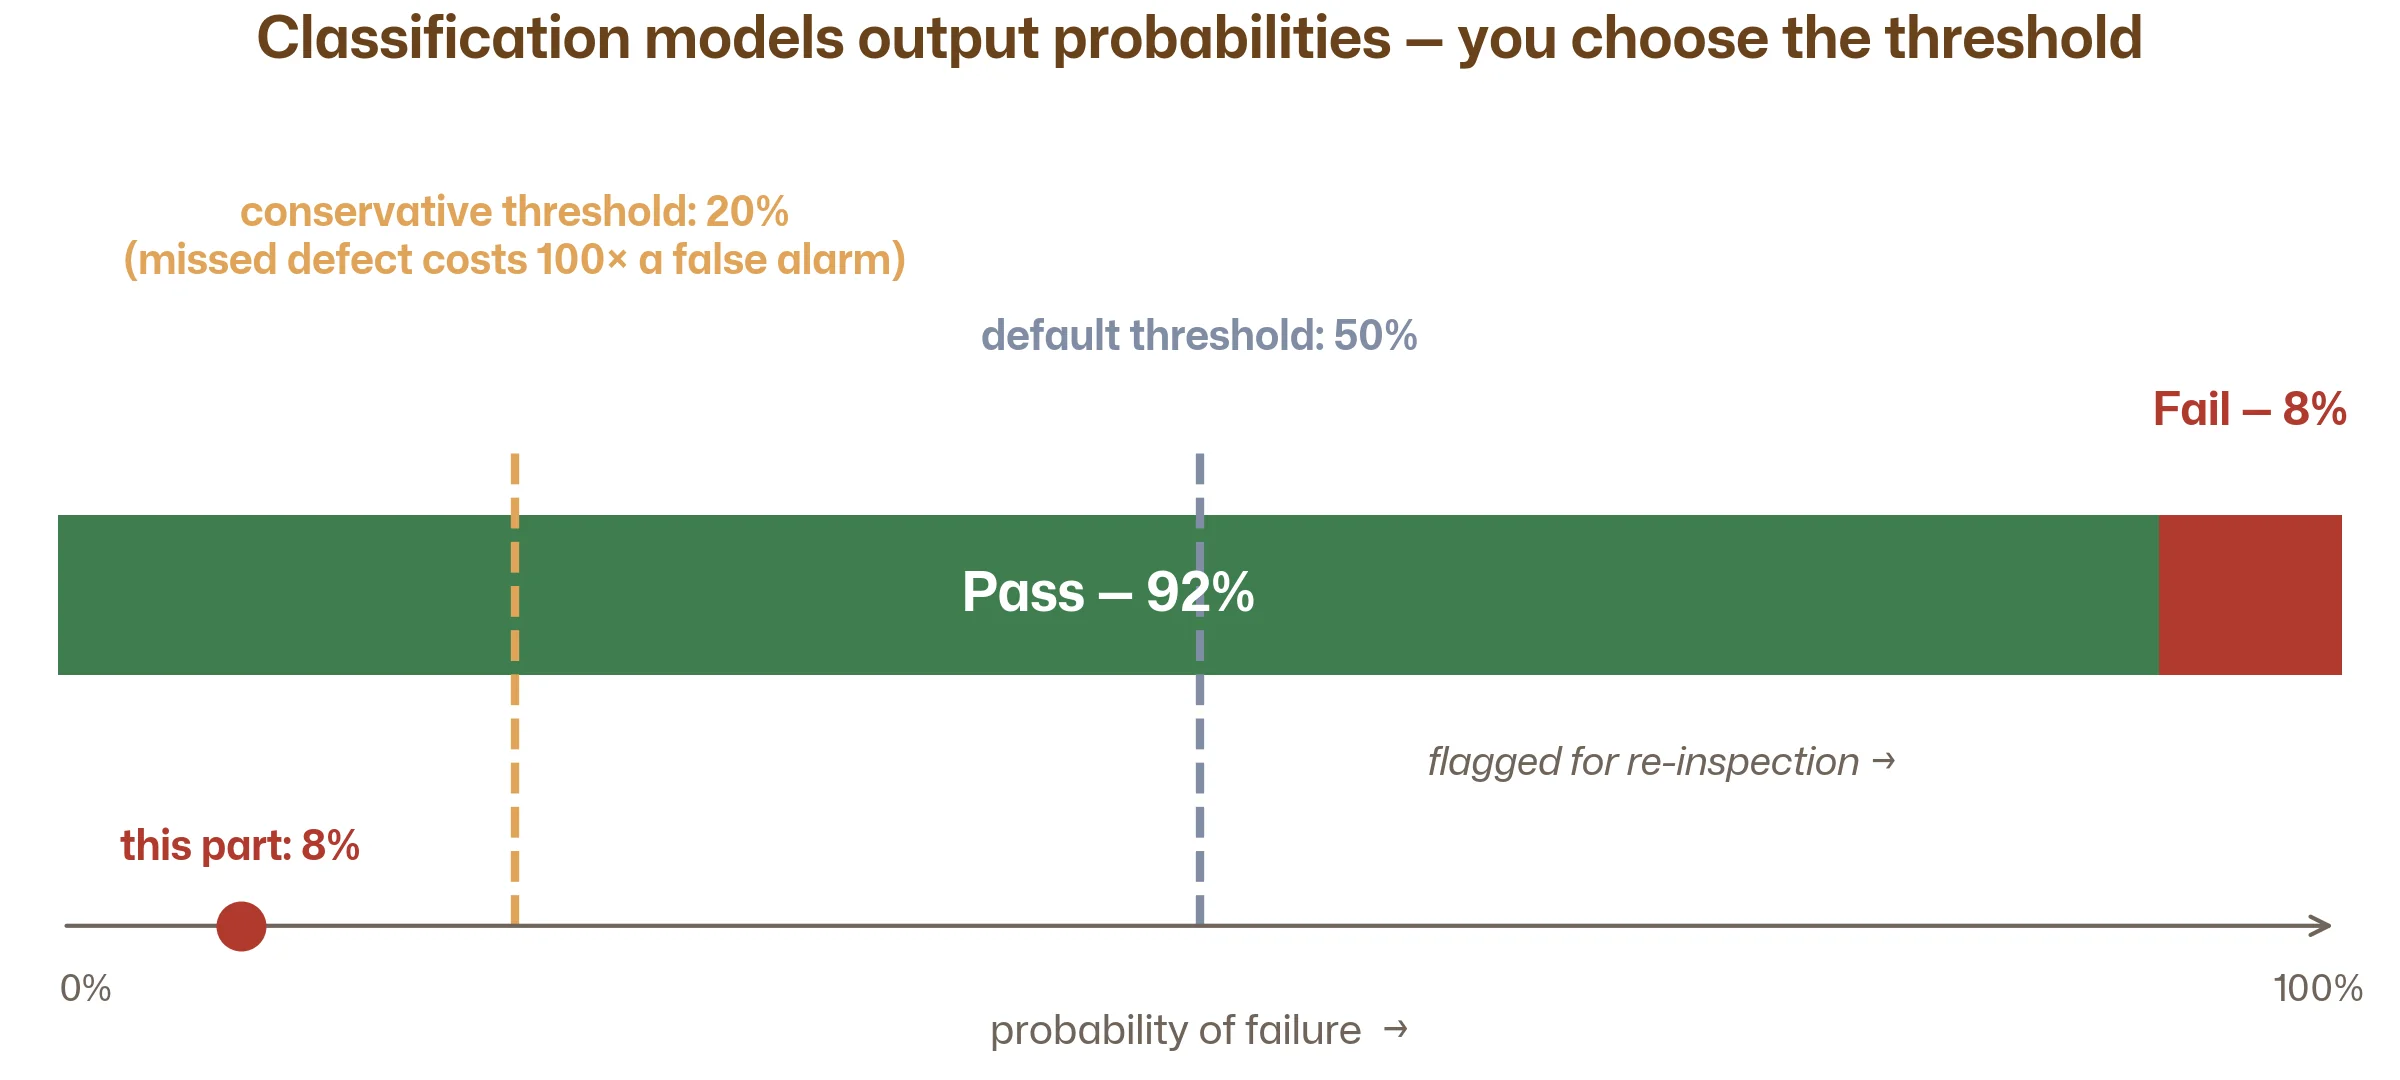
Here's something that surprises many people: most classification models don't just output a category. They output a probability for each category. The model might say "this weld has a 92% chance of being pass and an 8% chance of being fail." You then apply a threshold to make the final decision — typically 50%, but you can adjust it.
This matters enormously in engineering contexts. In a production line where a missed defect costs 100× more than a false alarm, you'd lower the threshold: flag anything with more than a 20% chance of being defective for re-inspection. You're trading precision for safety, and the model lets you make that trade-off explicitly.
We'll dive deeper into this in the Stage 3 article on evaluation metrics. For now, just know that classification models give you probabilities, not just yes/no answers, and that's a powerful tool for engineering decision-making.
Engineering use cases for classification
Quality inspection. Given process data from an injection moulding cycle — pressures, temperatures, timing, material properties — classify the resulting part as pass, rework, or scrap. This can run in real-time, flagging suspect parts before they reach the next production step.
Fault diagnosis. Given vibration features extracted from a bearing (RMS, peak frequency, kurtosis, crest factor), classify the fault type: inner race defect, outer race defect, ball defect, or healthy. Different fault types require different maintenance actions, so the classification directly informs the response.
Weld quality grading. Given welding process parameters (current, voltage, travel speed, heat input) and post-weld measurements, classify each weld into quality grade A, B, or C. This can supplement or prioritise manual inspection — inspect all Grade C welds, sample-check Grade B, pass Grade A.
Material identification. Given spectroscopic or composition data, classify an incoming material sample as one of several known alloy grades. Useful for incoming goods inspection where material mix-ups can have serious downstream consequences.
Same algorithms, different output
Here's something elegant about ML: many algorithms can do both regression and classification. The same fundamental approach — decision trees, random forests, XGBoost, even neural networks — works for both. The algorithm doesn't fundamentally change; only the output layer does.
In scikit-learn, this is reflected in the naming:
from sklearn.ensemble import RandomForestRegressor    # for predicting numbers
from sklearn.ensemble import RandomForestClassifier   # for predicting categories
Same algorithm. Same underlying logic. One predicts a number, the other predicts a category. When you learn how a decision tree works (coming up in Stage 2), you'll understand both versions — because the core idea is identical.
This also means you don't need to learn a completely separate set of algorithms for each type of problem. Master one set of tools, and you can apply them to both regression and classification tasks. The engineering problem determines which type you need; the algorithm adapts.
How to tell which one you need
Look at the output you want to predict and ask one question: is it a number or a category?
It's regression if:
- The output is a continuous measurement (stress, temperature, roughness, time, cost)
- The output can take any value within a range (not just specific options)
- You'd express the result with units (MPa, °C, µm, hours, kWh)
- Small differences in the output matter (predicting 245 MPa vs 250 MPa is meaningful)
It's classification if:
- The output is a label (pass/fail, defect type, material grade)
- The output comes from a fixed set of options
- You'd express the result as a category name, not a number
- The boundaries between categories are what matter, not precise values within them
The grey area: sometimes the boundary isn't obvious. Is "rate this weld quality from 1 to 5" a regression problem (because 1–5 is a scale) or classification (because there are only five options)? In practice, both approaches can work. If the difference between a 3 and a 4 matters and is meaningful, lean toward regression. If they're really just labels for distinct quality levels with no inherent "distance" between them, lean toward classification. Engineers overthink this — try both, compare the results, and use whichever performs better on your test set.

A word about the in-between: regression for classification (and vice versa)
In the real world, the line between regression and classification gets blurry in useful ways.
Using regression to inform classification. You might build a regression model that predicts remaining useful life (a number), and then use a simple threshold to classify: if predicted life < 100 hours, flag for maintenance. The regression model gives you a richer, more informative output; the classification is just a decision rule applied on top.
Turning a continuous measurement into categories. Your factory might define surface roughness categories: "fine" (Ra < 0.8 µm), "standard" (0.8–1.6 µm), "rough" (> 1.6 µm). You could train a classifier directly on these categories, or train a regression model to predict Ra and then apply the thresholds yourself. The second approach is often better — you get both the precise prediction and the category, and you can adjust the thresholds without retraining the model.
This flexibility is one of the practical strengths of ML. The models don't force you into rigid categories or rigid numbers. You choose the representation that's most useful for your engineering decision.
A quick self-test
Think about a problem at your work and decide:
Frame your problem type
What output would the model predict? Write it down.
Is it a number or a category?
- Number → regression
- Category → classification
If it's classification: how many categories?
- Two → binary (pass/fail, yes/no, good/defective)
- More than two → multi-class
If you can answer these three questions, you can frame any supervised learning problem. Combined with the features and labels you identified in the earlier article, you now have a complete problem definition: you know the inputs, the output, the type of output, and (roughly) how much data you have.
That's enough to start choosing an algorithm — which is exactly what Stage 2 is about.
Key takeaways
Regression predicts a number. Classification predicts a category. That's the only difference between the two types of supervised learning. The inputs, the algorithms, and the workflow are nearly identical.
Most engineering problems are clearly one or the other. Predicting stress, roughness, or energy consumption? Regression. Predicting pass/fail, defect type, or material grade? Classification. When it's ambiguous, try both.
Classification models output probabilities, not just labels. This lets you tune the decision threshold — a powerful tool when the cost of different errors is unequal, which is almost always the case in engineering.
The same algorithms work for both. Random Forest, XGBoost, and most other ML methods come in both a regression and classification version. Learn the algorithm once, apply it to either type of problem.
You now have the complete foundation. Features, labels, train/test split, supervised vs unsupervised, regression vs classification — these five concepts are the vocabulary of ML. Everything in Stage 2 builds on this foundation.
Frequently asked questions
Common questions about regression and classification in machine learning.
Yes — most popular ML algorithms come in both a regression and a classification variant. Random Forest has RandomForestRegressor and RandomForestClassifier. XGBoost has XGBRegressor and XGBClassifier. Decision trees, k-nearest neighbours, and neural networks all work for both. The underlying algorithm is the same; the difference is in the output: the regression version predicts a continuous number, and the classification version predicts a category (via probabilities).
It's classification. A classification model internally outputs a probability (e.g. "82% chance this part is defective"), which is then converted to a category by applying a threshold (e.g. above 50% → defective). The fact that the intermediate output is a number doesn't make it regression. The key question is: what do you ultimately want to predict? If it's a category — pass/fail, good/bad, type A/B/C — it's classification, even though probabilities are involved along the way.
You have two valid approaches. First, you can train a regression model to predict the number, then apply a threshold afterwards to convert it to a category (e.g. predict roughness, then label anything above 3.2 µm as "fail"). Second, you can convert your numbers to categories upfront and train a classifier directly. The regression-then-threshold approach often works better because it preserves more information during training — the model learns the full relationship, not just which side of a cut-off each sample falls on. Try both and compare.
That's called multi-class classification, and all the major algorithms handle it natively. Decision trees, Random Forest, XGBoost, and k-NN all work with any number of categories out of the box — you don't need to change anything. The model outputs a probability for each category and picks the one with the highest probability. In scikit-learn, the code is identical whether you have 2 categories or 20.
Yes, completely. For regression, you measure how far off the predictions are from the actual numbers — common metrics are RMSE (root mean squared error), MAE (mean absolute error), and R². For classification, you measure how often the model picks the right category — common metrics are accuracy, precision, recall, and F1-score. Using the wrong metric type is a common beginner mistake: RMSE is meaningless for a pass/fail problem, and accuracy is meaningless for a roughness prediction.
This is called ordinal classification — the categories have a natural order (low < medium < high), unlike nominal categories (red/blue/green) where there's no ranking. Standard multi-class classifiers will work, but they don't know the categories are ordered — they treat predicting "low" when the answer is "high" the same as predicting "medium." For a quick solution, you can encode the categories as numbers (1, 2, 3) and use regression, then round the output. For more sophisticated approaches, there are specialised ordinal classification methods, but they're rarely needed in practice.
Stage 1 complete
You've finished the Fundamentals. Stage 2 covers the algorithms — starting with linear regression, decision trees, and random forests. Subscribe and we'll send you a short email when the next article drops. No spam, no fluff.
Subscribe to the newsletter