The problem with a single split
In the Training Data vs Test Data article, you learned the most important rule in ML: never evaluate on the data you trained on. Split your data into training and test sets, and measure performance on the test set.
That rule is correct. But there's a problem with doing it only once.
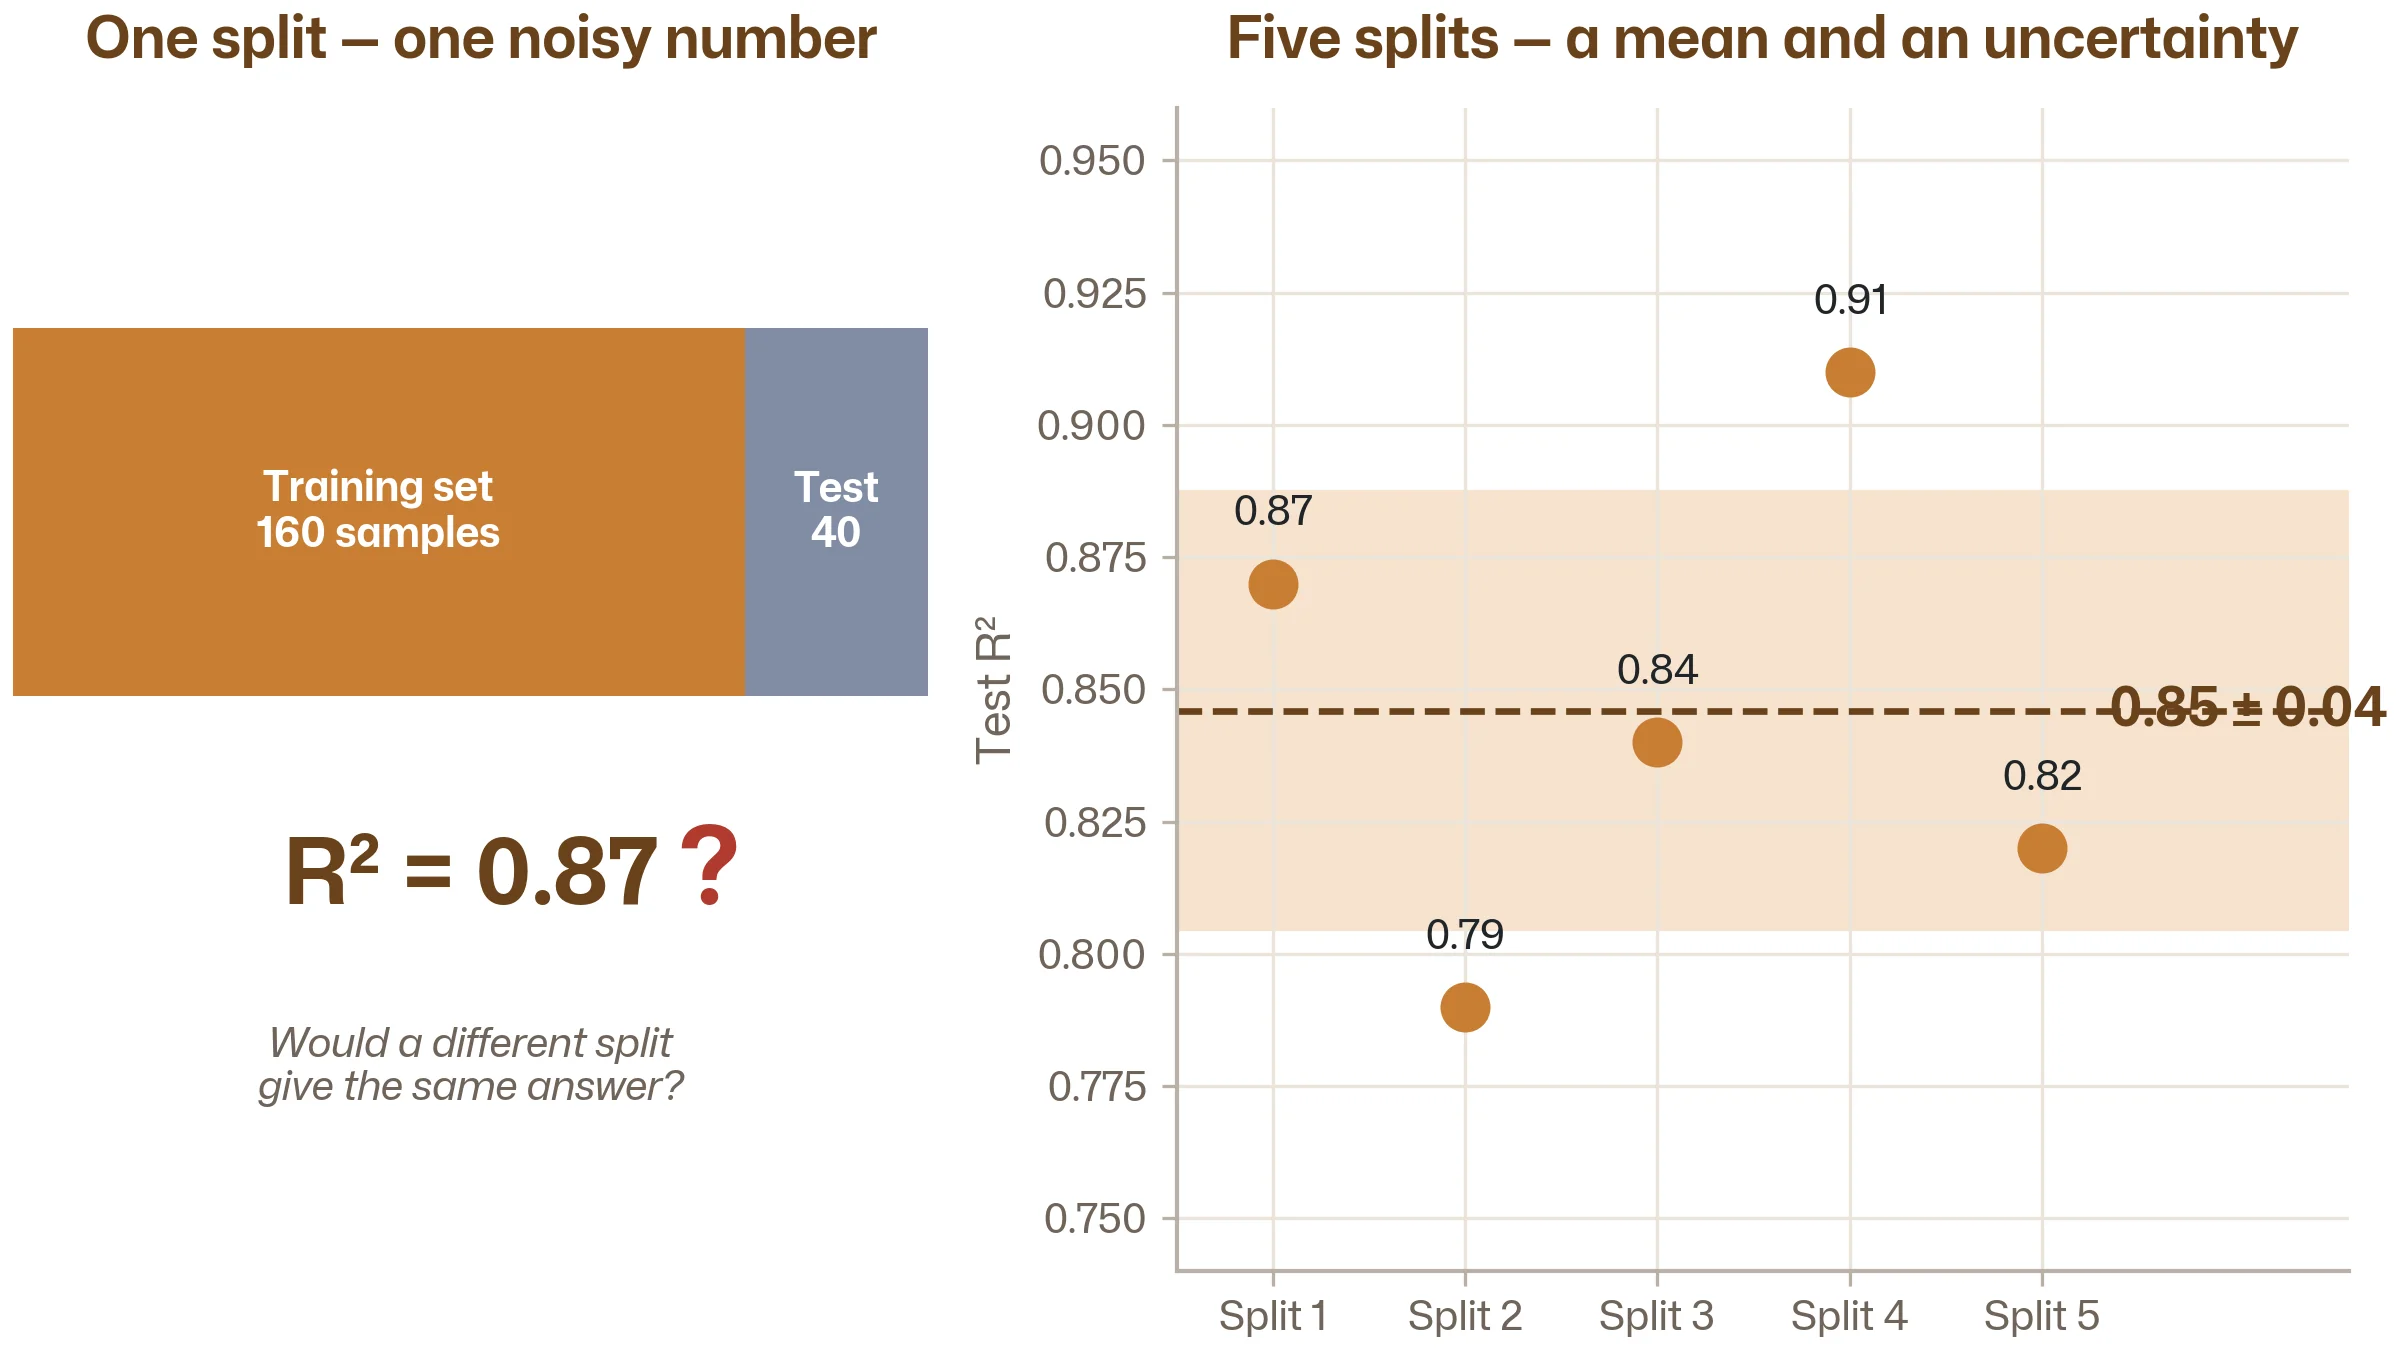
Imagine you have 200 data points from a welding process. You randomly put 160 in the training set and 40 in the test set. You train a Random Forest, and it scores an R² of 0.87 on the test set. Good result?
Now imagine you re-run the same code with a different random seed — a different random split. This time the test set happens to include several unusual welds that are harder to predict. The R² drops to 0.79.
Run it again. 0.84. Again. 0.91. Again. 0.82.
Same data. Same algorithm. Same hyperparameters. Five different answers, ranging from 0.79 to 0.91. Which one is the "real" performance of your model?
The answer: none of them individually. Each one is noisy — influenced by which specific data points happened to land in the test set. With only 40 test points, a few unusual samples can swing the result significantly.
This is the same problem every engineer faces with small sample sizes in physical testing. One tensile test gives you a data point. Five tests give you a mean and a standard deviation. The mean is more trustworthy than any individual measurement. Cross-validation applies exactly this logic to model evaluation.
How k-fold cross-validation works
The idea is simple and elegant:
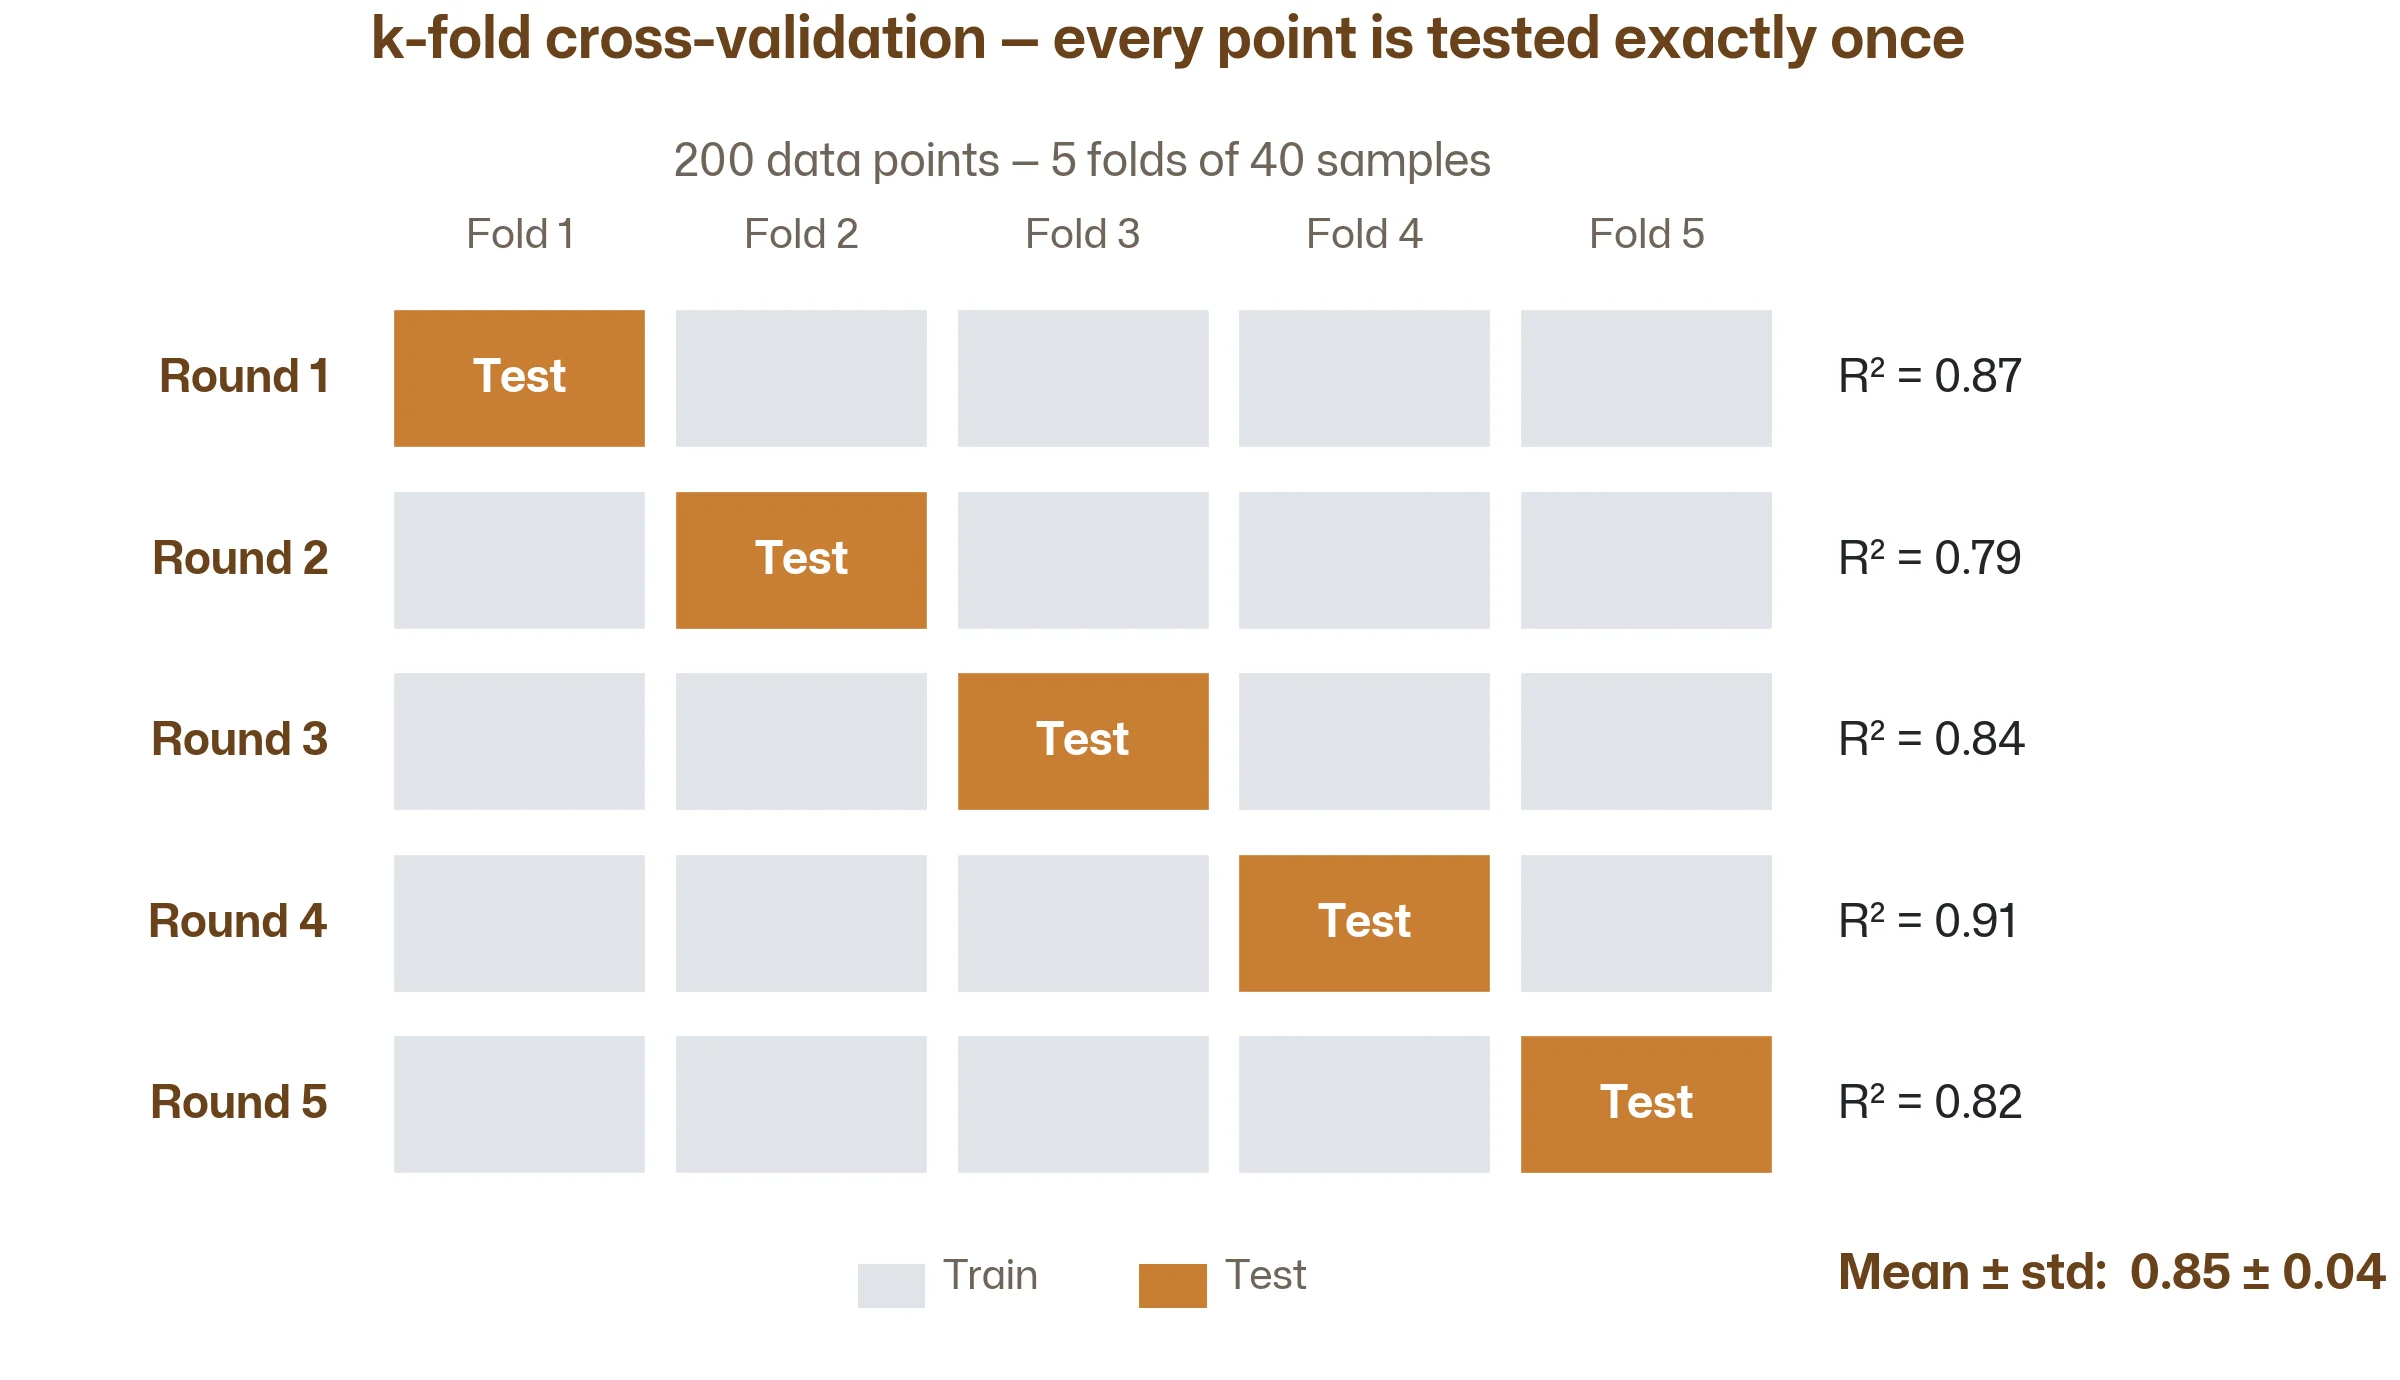
Step 1: Divide your data into k equal parts (called "folds"). Typically k = 5 or k = 10. With 200 data points and k = 5, each fold contains 40 data points.
Step 2: Train and evaluate k times. Each time, use one fold as the test set and the remaining k − 1 folds as the training set. Rotate which fold is the test set, so every data point gets to be in the test set exactly once.
Step 3: Average the results. You now have k performance scores — one from each fold. Report the mean and standard deviation.
For 5-fold cross-validation on 200 data points:
| Round | Training set | Test set | Score |
|---|---|---|---|
| 1 | Folds 2, 3, 4, 5 (160 samples) | Fold 1 (40 samples) | 0.87 |
| 2 | Folds 1, 3, 4, 5 (160 samples) | Fold 2 (40 samples) | 0.79 |
| 3 | Folds 1, 2, 4, 5 (160 samples) | Fold 3 (40 samples) | 0.84 |
| 4 | Folds 1, 2, 3, 5 (160 samples) | Fold 4 (40 samples) | 0.91 |
| 5 | Folds 1, 2, 3, 4 (160 samples) | Fold 5 (40 samples) | 0.82 |
| Mean ± std | 0.85 ± 0.04 | ||
Every single data point appears in the test set exactly once. No data point is ever used to both train and evaluate in the same round. And the final score — 0.85 ± 0.04 — tells you both how good the model is and how stable that estimate is.
The standard deviation (±0.04) is just as important as the mean. A score of 0.85 ± 0.04 means you can be reasonably confident the true performance is between about 0.81 and 0.89. A score of 0.85 ± 0.15 would mean much less — the model's performance is too erratic to trust.
Why not just use a bigger test set?
A natural question: if a 20% test set is noisy, why not use 50%? That would give you more test samples and a more stable score.
The trade-off: a larger test set means a smaller training set. With only 100 training samples instead of 160, your model learns from less data and probably performs worse. You'd get a more reliable estimate of a worse model — not ideal.
Cross-validation solves this elegantly. In each fold, you train on 80% of the data (almost all of it) and test on 20%. You get the benefit of a large training set and a reliable performance estimate, because you repeat the process five times and average.
The only cost is computation: you train the model five times instead of once. For algorithms like Random Forest and XGBoost on engineering-sized datasets, this takes seconds to minutes. A worthwhile trade for a trustworthy performance number.
Choosing k: how many folds?
k = 5: the most common choice. Good balance between computation time and reliability. Each fold has 20% of the data, and each model is trained on 80%. This is the default in most scikit-learn functions.
k = 10: more folds, slightly more reliable estimate, but 10 models to train instead of 5. Useful when you have enough data that 10% test sets still contain a reasonable number of samples.
k = n (Leave-One-Out): each fold contains exactly one sample. You train n models, each tested on a single data point. The most thorough approach, but extremely slow for large datasets. Useful for very small datasets (under 50 samples) where you can't afford to hold out even 20%.
The practical default: use k = 5. If your dataset is very small (under 100 samples), consider k = 10 or Leave-One-Out. If computation time is a concern and your dataset is large, k = 5 is more than sufficient.
Stratified cross-validation: essential for classification
If you're doing classification and your classes are imbalanced — say 90% good parts and 10% defective — there's a risk that some folds might contain very few (or zero) defective samples by random chance. This makes the evaluation unreliable.
Stratified k-fold ensures that each fold has approximately the same class distribution as the full dataset. If 10% of your data is defective, then roughly 10% of each fold will be defective too.
In scikit-learn, the cross_val_score function uses stratified folds automatically for classification tasks. For regression, folds are random. You rarely need to think about this — but it's worth knowing why your scores are stable even with imbalanced data.
Cross-validation in Python
Scikit-learn makes cross-validation a one-liner:
from sklearn.model_selection import cross_val_score
from sklearn.ensemble import RandomForestRegressor
import numpy as np

# Assume X = features, y = labels
model = RandomForestRegressor(n_estimators=100, max_depth=10, random_state=42)

# 5-fold cross-validation
scores = cross_val_score(model, X, y, cv=5, scoring='r2')

print(f"R² scores per fold: {scores}")
print(f"Mean R²: {scores.mean():.3f} ± {scores.std():.3f}")
That's it. One function call, five train-evaluate cycles, a mean and standard deviation. The scoring parameter lets you choose the metric — 'r2' for regression, 'accuracy' or 'f1' for classification (more on metrics in the next article).
For comparing two models:
from sklearn.ensemble import RandomForestRegressor
from xgboost import XGBRegressor

rf_scores = cross_val_score(RandomForestRegressor(n_estimators=100, random_state=42),
                            X, y, cv=5, scoring='r2')

xgb_scores = cross_val_score(XGBRegressor(n_estimators=200, max_depth=5, learning_rate=0.05, random_state=42),
                             X, y, cv=5, scoring='r2')

print(f"Random Forest: {rf_scores.mean():.3f} ± {rf_scores.std():.3f}")
print(f"XGBoost:       {xgb_scores.mean():.3f} ± {xgb_scores.std():.3f}")
Now you're comparing two models on exactly the same folds. If XGBoost scores 0.88 ± 0.03 and Random Forest scores 0.85 ± 0.04, you have an honest, apples-to-apples comparison. The mean tells you which is better on average; the standard deviation tells you how confident you can be in that difference.
Cross-validation for hyperparameter tuning
Cross-validation isn't just for evaluating a final model — it's also the standard way to choose hyperparameters.
Say you want to find the best max_depth for a Random Forest. You could try depth 5, 10, 15, and 20, and compare their cross-validation scores:
from sklearn.model_selection import cross_val_score
from sklearn.ensemble import RandomForestRegressor

for depth in [5, 10, 15, 20]:
    model = RandomForestRegressor(n_estimators=100, max_depth=depth, random_state=42)
    scores = cross_val_score(model, X, y, cv=5, scoring='r2')
    print(f"max_depth={depth:2d}: R² = {scores.mean():.3f} ± {scores.std():.3f}")
This might output:
max_depth= 5: R² = 0.82 ± 0.04
max_depth=10: R² = 0.87 ± 0.03
max_depth=15: R² = 0.86 ± 0.05
max_depth=20: R² = 0.84 ± 0.06
Depth 10 gives the best mean score and the tightest spread. Depth 20 has a lower mean and higher variance — signs of overfitting. You'd choose depth 10.
Scikit-learn automates this search with GridSearchCV and RandomizedSearchCV, which try many hyperparameter combinations and report the best one based on cross-validated performance. We won't go into the details here, but know that the principle is always the same: try a setting, measure it with cross-validation, pick the best.
The important subtlety: nested cross-validation
There's a subtle trap when you use cross-validation both for tuning hyperparameters and for reporting final performance. If you tune your hyperparameters to maximise the cross-validation score and then report that same score as your model's performance, you've essentially "evaluated on your validation data" — the same problem from the Training Data vs Test Data article, one level up.
The rigorous solution is nested cross-validation: an outer loop for performance estimation and an inner loop for hyperparameter tuning. In the outer loop, you hold out one fold for testing. On the remaining folds, you run a full cross-validation to choose the best hyperparameters. Then you evaluate on the held-out outer fold. Repeat for each outer fold.
In practice, this is important for academic papers and competition submissions, but less critical for everyday engineering work. If you're building a model to predict weld quality and your cross-validated R² is 0.87, the true performance won't be dramatically different even without nested CV. The important thing is that you're aware the number might be slightly optimistic.
Practical rule
Use cross-validation for everything, and you'll be ahead of 90% of ML practitioners. If you want to be rigorous, hold out a final test set that you never touch during tuning, and report performance on that.
Cross-validation vs out-of-bag evaluation
In the Random Forest article, we mentioned that Random Forests provide a free performance estimate through out-of-bag (OOB) scoring. How does that compare to cross-validation?
OOB scoring is specific to Random Forests and other bagging methods. It's fast (no additional training), but it only works for that one algorithm family. The estimate is generally reliable but can be slightly different from cross-validation.
Cross-validation works for any algorithm. It's more general and more widely accepted as a performance metric. It takes longer (you train the model k times), but it gives you a standard deviation alongside the mean — something OOB scoring doesn't provide.
The practical advice: use OOB for quick sanity checks during development with Random Forest. Use cross-validation for anything you'd put in a report or share with colleagues. When comparing different algorithms against each other, always use cross-validation — it's the only approach that gives an apples-to-apples comparison.
Key takeaways
A single train/test split gives you a noisy estimate. One number, dependent on which samples landed in the test set. Not reliable enough for serious decisions.
Cross-validation averages over multiple splits. Each data point is tested exactly once. You get a mean performance and a standard deviation — both are essential for honest evaluation.
Use k = 5 as your default. It's the standard, it's computationally cheap, and it provides a reliable estimate for typical engineering datasets.
Cross-validation is also your tool for comparing models and tuning hyperparameters. Same folds, same metric — the only fair way to compare two algorithms or two settings.
Always report the standard deviation, not just the mean. A score of 0.87 ± 0.02 is a reliable model. A score of 0.87 ± 0.12 means you don't really know how good it is. The uncertainty matters as much as the point estimate — every engineer knows this from physical testing.
Follow the learning path
This is the first article in Stage 3: Model Evaluation & Tuning. Subscribe and we'll send you a short email when the next one drops — plus monthly ML insights for engineers. No spam, no fluff.
Subscribe to the newsletter