The question every engineer asks first
You've trained a model. It predicts surface roughness from 15 process parameters with an R² of 0.89. Your manager's first question won't be "what algorithm did you use?" or "how did you tune the hyperparameters?"
It'll be: "Which parameters matter most?"
This is the question that turns ML from a prediction tool into an engineering insight tool. A model that predicts accurately but can't tell you why is useful — but a model that predicts accurately and tells you which inputs drive the output is transformative. That's the difference between "the model says this part will fail" and "the model says this part will fail, and the primary driver is melt temperature exceeding 215°C."
The good news: if you've been following this knowledge base and using tree-based models (Decision Trees, Random Forest, XGBoost), feature importance comes for free. It's a built-in byproduct of how these algorithms work. No extra computation, no add-on library — just one line of code.

How tree-based feature importance works
In a Decision Tree, every split divides the data using a specific feature at a specific threshold. Each split reduces the impurity (for classification) or the prediction error (for regression) by some amount. The more a feature is used for splits, and the more those splits reduce the error, the more "important" that feature is.
The definition
Feature importance = the total reduction in error contributed by all splits on that feature, normalised so all importances sum to 1.0.
A feature with importance 0.38 contributed 38% of the total error reduction. A feature with importance 0.02 barely helped at all.
In a Random Forest or XGBoost model, this is averaged across all trees. Since each tree sees different data subsets and different feature subsets, the average is much more stable and reliable than what you'd get from a single tree.
# After training a Random Forest or XGBoost model
importances = model.feature_importances_

# Print sorted by importance
for name, imp in sorted(zip(feature_names, importances), key=lambda x: -x[1]):
    print(f"  {name}: {imp:.3f}")
This might output:
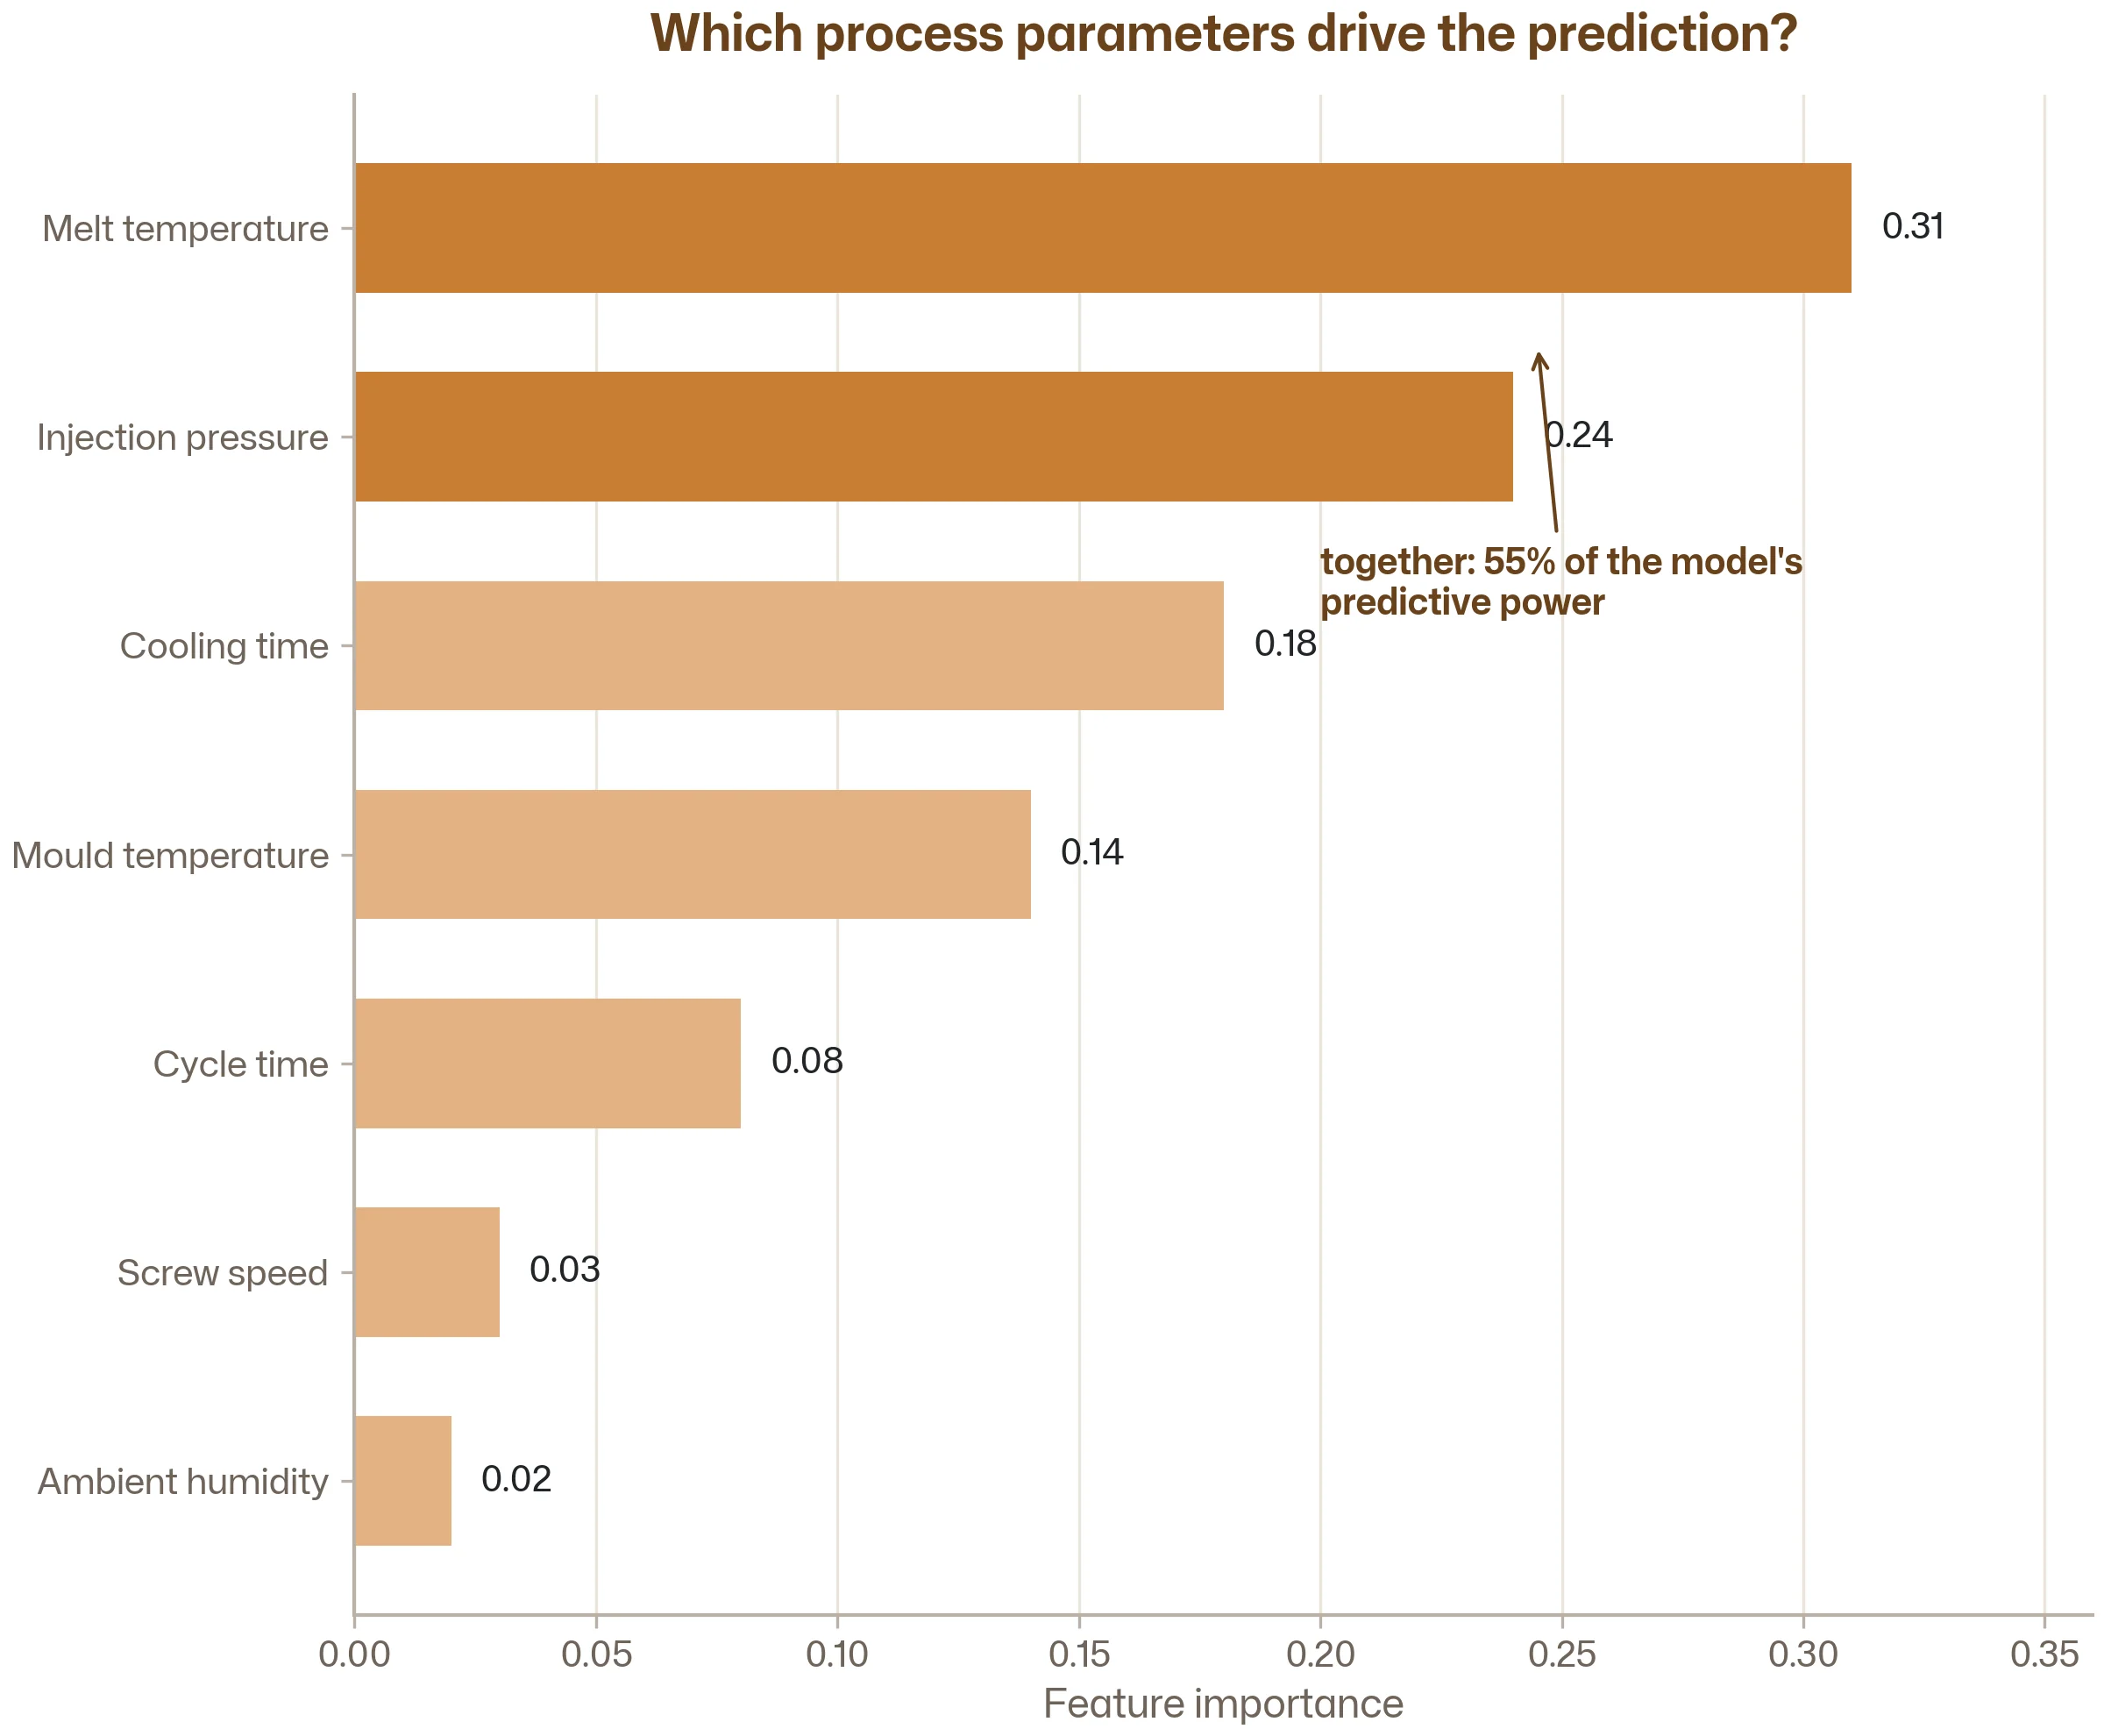
  melt_temperature: 0.31
  injection_pressure: 0.24
  cooling_time: 0.18
  mould_temperature: 0.14
  cycle_time: 0.08
  screw_speed: 0.03
  ambient_humidity: 0.02
Immediately actionable: melt temperature and injection pressure together account for 55% of the model's predictive power. If you want to reduce defects, those are the process parameters to focus on. Ambient humidity and screw speed barely register — they're probably not worth monitoring closely for this particular quality outcome.
A horizontal bar chart is worth a thousand numbers
Feature importance is best communicated as a horizontal bar chart, sorted from most to least important. This is the single most useful plot you can show to a non-technical stakeholder.
import matplotlib.pyplot as plt
import numpy as np

# Sort features by importance
sorted_idx = np.argsort(model.feature_importances_)
sorted_features = np.array(feature_names)[sorted_idx]
sorted_importances = model.feature_importances_[sorted_idx]

# Plot
plt.figure(figsize=(8, 5))
plt.barh(sorted_features, sorted_importances)
plt.xlabel("Feature Importance")
plt.title("Which process parameters drive the prediction?")
plt.tight_layout()
plt.savefig("feature_importance.png", dpi=150)
plt.show()
This plot works in every context: design reviews, quality investigations, management presentations, technical reports. An engineer who shows this chart is speaking a language everyone understands: "here's what matters, ranked."
What feature importance tells you (and what it doesn't)
What it tells you
Which features the model relies on. A high-importance feature is one the model uses heavily to make predictions. If you removed it, the model's performance would suffer significantly.
Where to focus engineering effort. If melt temperature has 3× the importance of cooling time, process improvement efforts focused on temperature control will likely have more impact on quality than efforts focused on cooling.
Which features might be redundant. Features with near-zero importance can often be removed from the model without hurting performance. Simpler models with fewer inputs are easier to deploy, monitor, and maintain.
What it doesn't tell you
It doesn't tell you the direction of the effect. A feature importance of 0.31 for melt temperature tells you it matters, but not how. Does higher temperature increase or decrease defects? Feature importance doesn't say. For that, you need partial dependence plots or SHAP values (covered in Stage 4).
It doesn't prove causation. A high importance for "ambient humidity" doesn't mean humidity causes defects. It might be that humidity correlates with something else (like a seasonal maintenance schedule) that's the real driver. Feature importance reveals statistical association, not causal mechanism. Your engineering knowledge is essential for interpreting whether a statistical relationship makes physical sense.
It can be misleading with correlated features. If melt temperature and barrel temperature are highly correlated (as they often are), the importance gets split between them somewhat arbitrarily. Both might show moderate importance, when in reality the underlying driver is one physical phenomenon. This doesn't mean the importance scores are wrong — it means you need to interpret them with domain knowledge.
Permutation importance: a more robust alternative
The built-in feature importance in tree-based models (called "impurity-based importance") has a known bias: it tends to favour features with many unique values (continuous features) over features with few unique values (categorical features). This is a technical quirk of how impurity reduction is calculated.
Permutation importance avoids this bias entirely. The idea is simple and intuitive:
1. Train the model and measure its test performance (e.g. R² = 0.89).
2. Take one feature — say, melt temperature — and randomly shuffle its values across all test samples. This breaks the real relationship between temperature and the output.
3. Measure the test performance again. If it drops to R² = 0.71, that feature was critical.
4. Repeat for each feature.
Key intuition
The drop in performance when a feature is shuffled is its permutation importance. A feature that causes a large drop is genuinely important. A feature whose shuffling barely affects the score wasn't contributing much.
from sklearn.inspection import permutation_importance

# After training the model
result = permutation_importance(model, X_test, y_test, n_repeats=10, random_state=42)

# Print results
for name, imp, std in sorted(zip(feature_names, result.importances_mean, result.importances_std),
                              key=lambda x: -x[1]):
    print(f"  {name}: {imp:.3f} ± {std:.3f}")
Notice the ± std — permutation importance gives you an uncertainty estimate because it repeats the shuffling process multiple times. A feature with importance 0.15 ± 0.01 is reliably important. One with 0.15 ± 0.12 might be noise.
When to use which:
- Impurity-based importance (
model.feature_importances_): fast, available immediately, good for quick exploration. Use as your default. - Permutation importance: slower, but more reliable and less biased. Use for final reports, when comparing continuous and categorical features, or when correlated features are a concern.
Feature importance in practice: an engineering workflow
Step 1: Train an initial model with all features. Don't worry about selecting features yet — just throw everything in and see what the model makes of it.
Step 2: Look at feature importances. Which features matter? Which are negligible? Do the top features make physical sense? If ambient humidity shows up as the most important predictor of injection moulding quality, something is probably wrong with the data — not with the physics.
Step 3: Investigate surprising results. If a feature you expected to matter doesn't, ask why. Is it measured poorly? Is it constant in your dataset (no variation = no predictive power)? If a feature you didn't expect shows up as important, investigate. It might be a genuine discovery — or a data artefact (like batch number correlating with a process change you forgot about).
Step 4: Remove unimportant features and retrain. Drop features with near-zero importance and see if the model performs equally well. Often, removing the bottom 30–50% of features has no impact on accuracy and produces a simpler, more interpretable model.
Step 5: Present the results. The feature importance chart is your first deliverable from any ML project — even before you deploy the model for predictions. "We analysed 18 months of production data, and the three parameters most strongly associated with defect rate are X, Y, and Z" is a finding that drives process improvement regardless of whether the predictive model ever goes into production.
The insight loop
This is what makes ML valuable in engineering. The prediction is useful. The feature importance is often more useful.
From global importance to individual explanations: a preview of SHAP
Feature importance answers the question "which features matter overall?" But sometimes you need to answer a different question: "why did the model make this specific prediction?"
Suppose the model predicts that a particular part is defective. The quality team wants to know: was it the temperature? The pressure? The material batch? Feature importance tells you what matters on average, but it doesn't tell you what drove this one prediction.
That's where SHAP comes in — a method that decomposes each individual prediction into contributions from each feature. "For this specific part, high melt temperature added +0.15 to the defect probability, while normal injection pressure subtracted −0.08."
We'll cover SHAP in detail in Stage 4. For now, think of feature importance as the global view (which features matter across all predictions) and SHAP as the local view (which features drove one specific prediction). Both are valuable. Feature importance is your starting point; SHAP is the deep dive.
Key takeaways
Feature importance ranks which inputs drive the model's predictions. It's a built-in feature of tree-based models — one line of code gives you a ranked list of your most influential variables.
It transforms ML from a prediction tool into an insight tool. The feature importance bar chart is often the most valuable deliverable from an ML project — it tells engineers where to focus process improvement efforts.
Use impurity-based importance for quick exploration, permutation importance for final reports. Both measure the same concept, but permutation importance is more robust and includes uncertainty estimates.
Always interpret with engineering knowledge. Feature importance shows statistical associations, not causal mechanisms. A surprising result might be a genuine discovery or a data artefact — your domain expertise is what tells the difference.
This is the global view. SHAP provides the local view. Feature importance tells you which features matter overall. SHAP tells you which features drove a specific prediction. Both are covered in this knowledge base.
Stage 3 complete
You've finished Model Evaluation & Tuning. You now know cross-validation, classification and regression metrics, and feature importance — the tools to honestly assess and understand your models. Stage 4 covers advanced concepts. Subscribe and we'll let you know when it's ready.
Subscribe to the newsletter